Mastering Technical Analysis on Haqqex Spot Trading
Technical analysis (TA) is the study of historical price and volume data to forecast future market movements. Haqqex’s Spot Trading interface offers a suite of tools perfectly suited for conducting TA effectively. Below, we’ll walk through five key features of the Haqqex trading screen and share practical tips on how to leverage them for smarter, data-driven trading decisions.
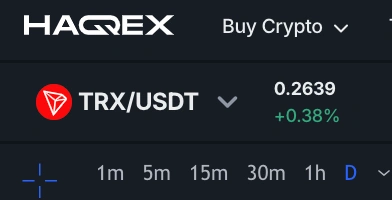
1. Timeframe Selector (1m, 5m, 15m, 30m, 1h, 1D)
Feature: At the top of the chart you can toggle between multiple timeframes—ranging from 1-minute up to daily.
Tip: Shorter timeframes (1m–15m) are ideal for scalpers looking for quick in-and-out trades, while longer frames (1h–1D) help you spot major trend reversals.
How to use it:
Day Trading: Monitor 5-minute and 15-minute candles to identify intraday support and resistance levels.
Swing Trading: Switch to 1-hour or daily charts to confirm overall trend direction before executing larger positions.
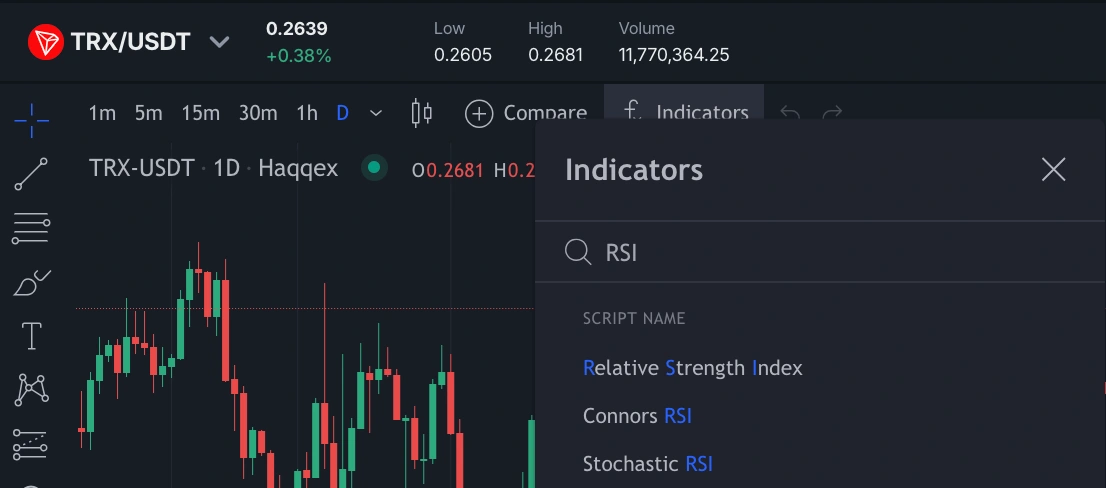
2. Built-in Indicators Panel
Feature: Clicking Indicators opens a library of common TA tools—Moving Averages, RSI, MACD, Bollinger Bands, and more.
Tip: Start simple. Add a 50-period SMA (Simple Moving Average) to gauge mid-term trend and overlay a 200-period SMA to identify long-term support/resistance.
How to use it:
Golden Cross/Death Cross: Look for the 50-SMA crossing above the 200-SMA (bullish) or below (bearish).
Momentum Check: Apply RSI (14) to detect overbought (above 70) or oversold (below 30) conditions.
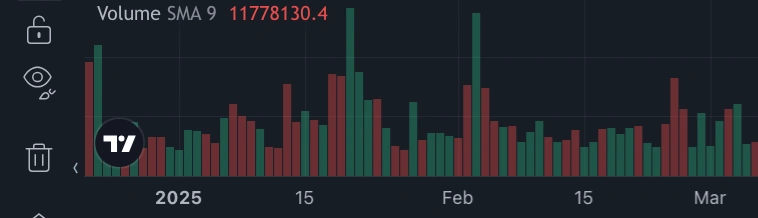
3. Volume SMA Overlay
Feature: The chart’s lower pane shows Volume bars with an SMA 9 overlay indicating average traded volume.
Tip: Spikes in volume often precede strong price moves. A candle break with volume significantly above the SMA 9 suggests conviction behind that move.
How to use it:
Breakout Confirmation: When price breaches a key level, ensure volume exceeds the average line—higher volume breakouts have a higher probability of sustaining.
Divergence Detection: If price makes a new high but volume doesn’t, it can indicate weakening momentum.
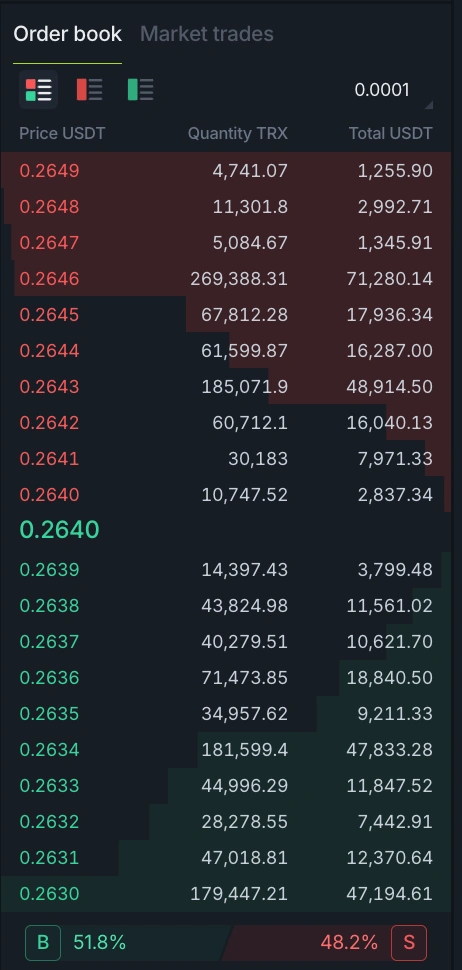
4. Order Book Depth & Market Trades
Feature: The Order Book on the right lists live bid and ask prices, quantities, and aggregate depth. Below it, the Market Trades tab streams recent fills.
Tip: Large limit orders clustered at a price level can act as temporary support or resistance. Watching real-time trades shows whether aggressive buyers (takers) are dominating.
How to use it:
Support/Resistance Zones: If you see a thick wall of buy orders at $0.2635, anticipate a potential floor—price may bounce there.
Order Flow Analysis: A flurry of large sell-side market orders hitting the bids can signal an impending drop.
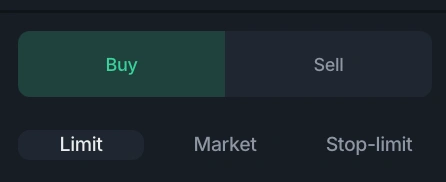
5. Buy/Sell Panel (Limit, Market, Stop-Limit)
Feature: On the right, the Buy/Sell widget lets you place Limit, Market, or Stop-Limit orders. Quick-percent buttons (25/50/75/100) auto-fill quantity based on your available USDT balance.
Tip: Use Stop-Limit orders to automate your entry or exit at precise levels, eliminating emotional delays.
How to use it:
Limit Entry: If TA shows strong support at $0.2620, set a limit buy there rather than chasing a market order at a higher price.
Stop-Limit Exit: Protect profits by placing a stop at a recent swing low—for example, a stop-limit sell at $0.2600 to lock in gains if price reverses.
Putting It All Together
-
Identify Trend: Use SMA crossovers and multi-timeframe analysis.
-
Confirm with Volume: Ensure breakouts or reversals come with above-average volume.
-
Watch the Order Book: Anticipate support/resistance from liquidity walls.
-
Plan Entries/Exits: Execute with limit and stop-limit orders to manage risk.
-
Monitor Correlations: Compare with major assets to refine your strategy.
By mastering these Haqqex features, you’ll gain a comprehensive TA workflow—spotting opportunities, validating them with data, and executing trades precisely.
Start exploring each tool on Haqqex today, and elevate your technical analysis to the next level!